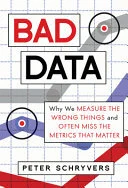
The book: Bad Data: Why We Measure the Wrong Things and Often Miss the Metrics That Matter by Peter Schryvers provides many examples and stories where obsession for collecting data has unintended consequences. One of my favorite stories is the Cobra Effect. As background, he describes how public schools so focused on testing to get federal funding led to widespread cheating. In India, the British colonist offered to buy poisonous cobras from locals in an effort to remove them. However, Indian people began growing more cobras to sell and when the British found out and stopped paying money, the Indians then freed their home-grown snakes. That created a bigger cobra problem than in the beginning! That might explain why I saw so many snake charmers during my visit to Mumbai 25 years ago.
Other interesting examples include the New York Police Department’s effort to get precincts competing based on crime statistics leading to under reporting and not listening to citizen complains that led to loss of trust. The author states that TRUST is one of the main reasons metrics are being collected in schools, homes, businesses and more.
More precisely, lack of trust affects everything from health care, environmental solutions, to worker productivity. Doctors rated on performing high-quality procedures leading to positive outcomes may not take on risky patients that could hurt their rating. Environmental trade-offs comparing light bulbs or where to live must consider total costs and not just obvious factors. A real-estate agent may show you less expensive homes far away from your workplace that will cost you more when factoring in transportation costs to work and shopping.
Bad Data was published in early 2020 but I wish it could have covered the Covid-19 pandemic. Schryvers discusses misunderstanding metrics to measure disease effects on a population. He lists three metrics: prevalence, incidence, and mortality. Prevalence is the number of people affected divided by population (usually 100,000 people). Incidence is the number of people contracting the disease over a period of time like in one year. Mortality is the number of people dying from the disease. He states decrease in prevalence of an illness may sound like good news but actually means fewer people are living with the disease as more people are dying quickly. Therefore, we must think critically when people are citing comparisons in these and other metrics. Testing for Covid-19 comes to mind when comparing total numbers of tests given for a country must consider the “per population” to be meaningful.
One of the best examples of a solution for the ills of Metrics is what the author calls Gateways. Khan Academy, is the non-profit that offers free videos online for mastery of education. The book is well worth reading to hear many great examples, including how Salman Khan started making videos to share with his family and became a worldwide sensation. Imagine taking middle school kids for a summer class and start at 1+1 to correct any gaps in knowledge. There is an interesting TED talk by Sal Khan talking about how even an A students scoring anything below 100% will accumulate gaps in understanding subjects that need to be corrected in order to advance to higher learning (like becoming a doctor) and this takes a longer time than offered by traditional academia where tests are timed and classes progress at the same pace. We are enjoying the Khan Academy videos that teach math, history and interviews with famous icons like Bill Gates and Elon Musk.
In summary, it’s all about Lifelong Learning and finding the correct metrics and gateways for learning from our collective experiences which is key to staying alive especially with challenges with Covid-19, Climate Change, Economic Recessions and Depressions, and surviving/overcoming related calamities.

